It is indeed a change of mindset to break up larger applications into smaller, contained services. One aspect of the transition, that is often somewhat overlooked, is the log file havoc that often sneak up on you when you least want it.
Logging is inherently difficult to make right. I believe one reason for this is that as a developer, running the application locally, there are better tools available for understanding what’s going on. .NET developers has been spoiled by the first class debugging experience in Visual Studio for quite some time. My experience is that logging is often an after-thought to a period of optimistic testing.
Logging is often an after-thought to a period of optimistic testing.
The situation does not get any better after the code is released to an clustered production environment. For a medium sized business with a few servers, a couple services/applications (deployed to each server) and RESTful APIs there are easily 50+ applications writing logs at the same time. I don’t want to be the one to make sense of these events without the right tools.
The key to understand what’s going on
It is invaluable to follow logical execution paths across applications. One way to understand (and be able to reproduce) a bug in an application is to identify how the execution was started - perhaps in application A, that invoked application B that in turn invoked the failing application.
If the applications deal with end user interaction, I find it useful to shift focus to what the specific user was doing just before the exception occurred. That can be a big clue to understanding how the user ended up in the state that allowed for the fault to occur.
It turns out that there are some pretty straight forward ways to achieve just that.
Say hello to the logging stack
I, together with a huge number of developers, am a big fan of elastic and kibana. In the off-change that you are not familiar with these products, they are the E and K of “the ELK stack”, made for creating indexes (elastic) and querying/visualizing them (kibana).
However, instead of using logstash1 for pushing data to elastic, I favor Serilog’s Elastic Sink. It is reliable and integrated with the application, removing the need for yet another service running on your systems. There are also some additional perks with this approach that I will come to in just a while.
Capture initial context data
The execution must start somewhere. For me, that is often in an ApiController. A request handler publish one or a few messages on RabbitMq through RawRabbit, and of it goes.
In addition to a unique ExecutionId for all code execution triggered by the request, I find it helpful to have Origin that is the request url, and SessionId that is unique for each user session.
var executionId = Guid.NewGuid();
var origin = HttpContext.Current.Request.Url.ToString();
var sessionId = GetSessionIdFromCookie(pipe);

Logger.Information(
  "Starting execution {executionId} for {sessionId} originated from {origin}",
  executionId, sessionId, origin
);
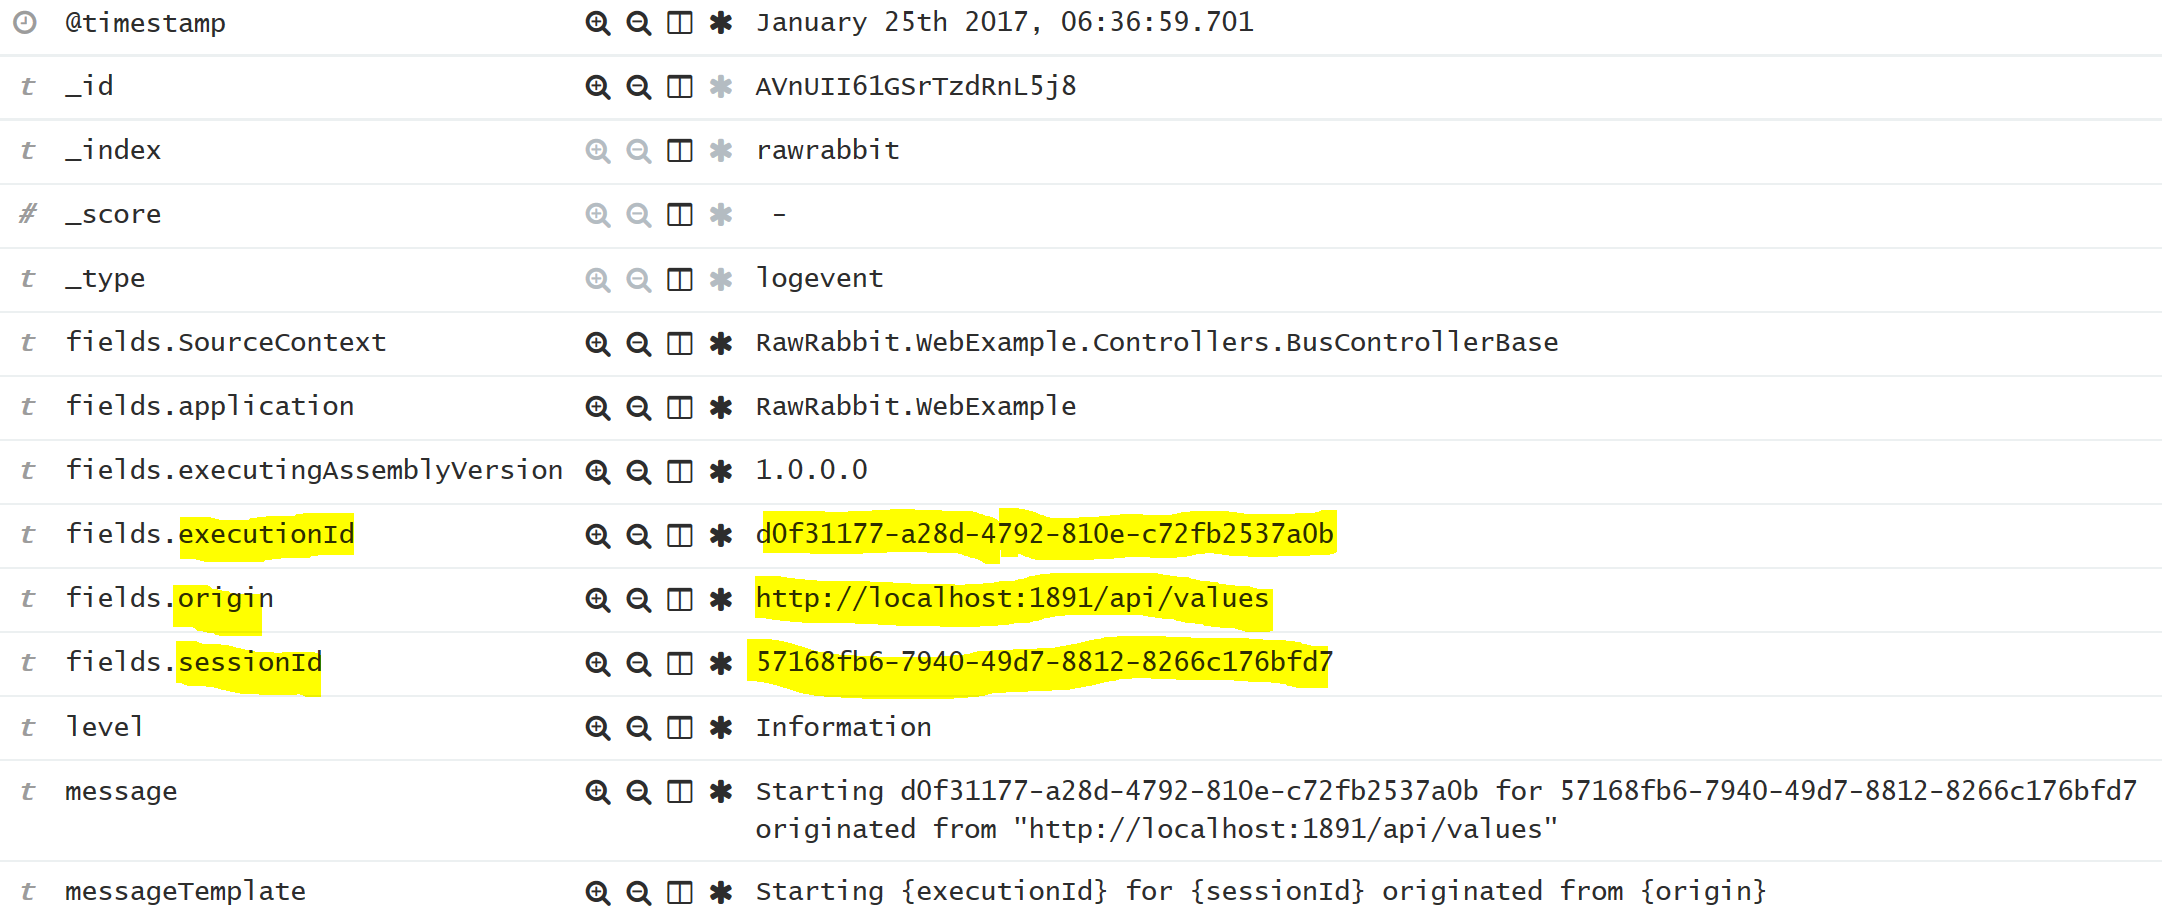
Note that there is no string interpolation (dollar sign) in the logging statement. This is part of the Serilog syntax, that helps storing the data in a structured way. For Elastic, in particular, this means that the values inside {} are captured as it’s own field that can be indexed and queried. The entry created by the log statement above looks something like this is Kibana
Passing context data to services
The context data that we just created needs to be included in the message we publish. Even though the message context2 is not mandatory as of version 2.0 of RawRabbit, I still find it useful to pass meta data such as this in it. There are many different ways to declare the message context, one of the most straight forward is to simply declare it
var context = new CustomContext
{
  ExecutionId = executionId,
  Origin = origin,
  SessionId = sessionId
};

busClient.PublishAsync(
  message: new BasicMessage(),
  context: ctx => ctx.UseMessageContext(context)
);
This kind of code, the creation and usage of message context, makes sense to have in some sort of base class abstraction, so that it can be reused each time a message is published.
Enrich consumer logs
The service that receives the message has access to the message context, and theoretically it can be passed around throughout the execution path and explicitly forwarded (like above) in any future messages published. That approach is however not feasible. Luckily, there are other ways to do that. The LogContext3 can be used to enrich logs with additional properties.
BusClient.SubscribeAsync<BasicMessage, CustomContext>(async (message, context) =>
{
  using (LogContext.PushProperty("executionId", context?.ExecutionId))
  using (LogContext.PushProperty("origin", context?.Origin))
  using (LogContext.PushProperty("sessionId", context?.SessionId))
  {
    Logger.Information("Message processed!");
    BusClient.PublishAsync(new NextMessage());
  }
});
Serilog uses AsyncLocal to make sure that the properties pushed to the log context are present in the execution path, even though it might be async. For us, it means that all logs written within the scope of the message handler will have these properties as fields in Elastic.
For me, the code above is abstracted to a base class, and I have also added metrics logging for execution time so that it is easy to create graphs over critical handlers.
Implicit forwarding message context
The message handler above publishes another message that will be handled by a different service. In this simplified example the message context is available in the same method as the publish is performed, but my experience is that it is not always the case.
However, by using Message Context Forwarding in RawRabbit the context will be implicit forwarded. In order to get this to work, make sure to add the plugin to the client
var busClient = RawRabbitFactory.CreateSingleton(new RawRabbitOptions
{
  Plugins = p => p
    .UseContextForwaring()
    .UseMessageContext<CustomContext>()
});
The context forwarding looks for an existing message context and uses it if present (instead of creating a new one). This is how executionId and the other properties are forwarded to the next service.
I’m able to filter the logs in Kibana based on execution id, and the only entries I see are the ones I expect
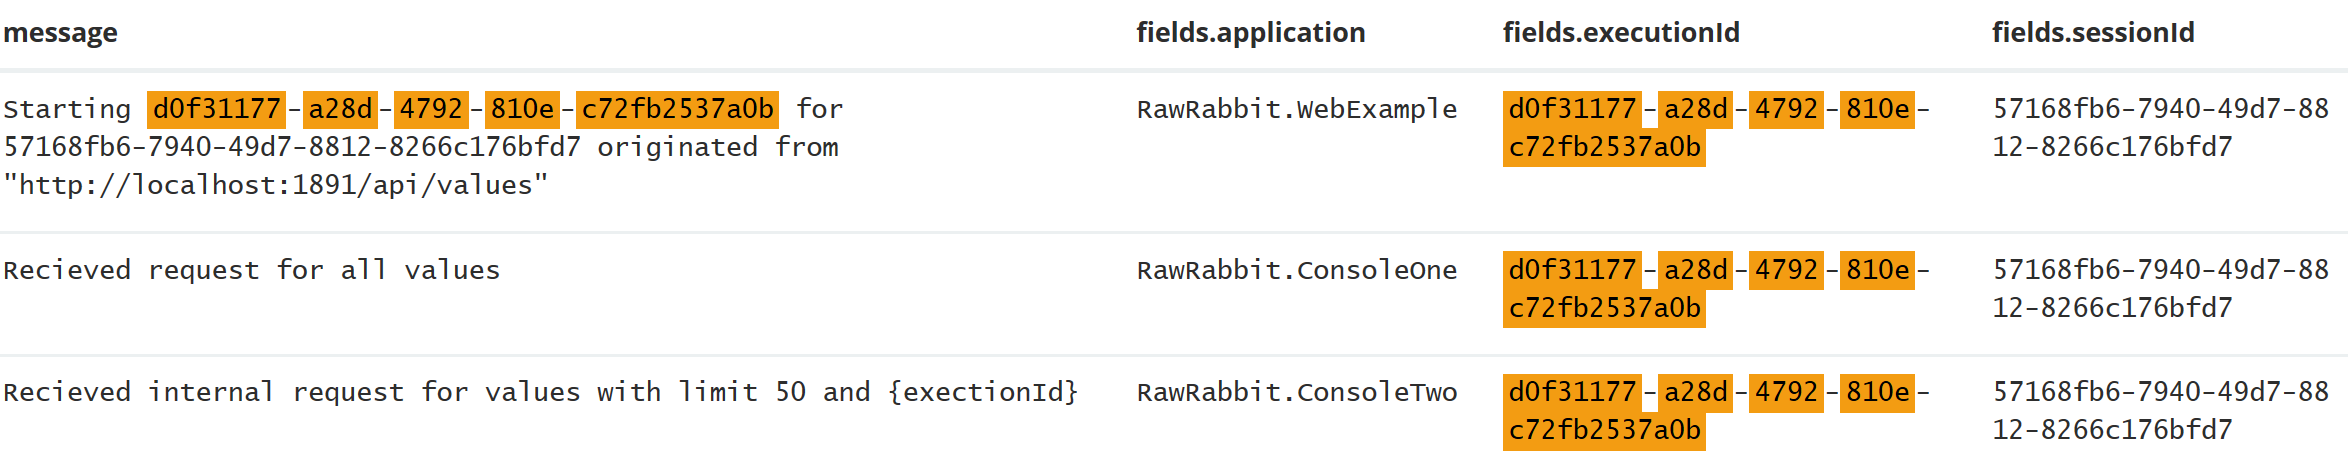
Logging in action! Here are the execution logs from two console apps and one web api. To make more sense of the logs I enriched them with the application field.
Remember that I could just as easily filter on a specific origin to see if exceptions are initiated from the same end point, or sessionId to all action from one user.
Summary
Logging can pretty fast become pretty complex. In my experience, it is worth taking the time to set up infrastructure as early as possible and try to incorporate it in the framework. It can be a good idea to setup Elastic/Kibana locally and use that for trouble shooting sometimes. That way, bad logging can be found before something crucial has happened in production and the logs are your only clue.
Happy logging!
Footnotes
-
The L of the ELK stack ↩
-
Message meta data, read more in the documentation. ↩
-
There’s excellent explanations on the project’s Github. ↩